Debt to Equity Ratio Calculator and Formula

Divide total liabilities by shareholders' equity, run the arithmetic on your own balance sheet, and read the result without leaning on a universal benchmark.
Divide total liabilities by shareholders' equity. Both numbers sit on the same balance sheet, and the SEC's beginners' guide to financial statements describes the calculation in exactly those terms, while FINRA words it the same way and defines total shareholder equity as total assets minus total liabilities. The calculator below puts total liabilities in the numerator, meaning everything the business owes rather than loans alone. BDC words the same ratio as total debt against the amount owners originally invested plus earnings retained over time, so a narrower debt numerator applied to the identical statement yields a lower figure.
Debt to equity ratio calculator
Total liabilities as reported on the balance sheet: everything the business owes, including borrowed money along with rent, taxes, payroll and amounts owed to suppliers, not only interest-bearing loans.
The debt to equity ratio formula
Debt-to-equity ratio = total liabilities ÷ shareholders' equity
Take both figures from one balance sheet, dated the same day. If the equity subtotal on your statement looks unfamiliar, FINRA's derivation gives you a cross-check: total assets minus total liabilities is shareholders' equity, described as a rough estimate of what would remain for shareholders if every asset were sold and every liability paid off. That is arithmetic on recorded book values rather than a market price, so treat it as a check on the denominator and nothing more.
Which balance sheet numbers to use
A balance sheet reports what a company owns and what it owes at a fixed point in time, with detail on assets, liabilities and shareholders' equity. Both inputs come from that one report.
For the numerator, use the total liabilities subtotal. FINRA's description of the balance sheet lists borrowed money, rent, taxes, payroll and money owed to suppliers among liabilities, which is why that subtotal is broader than the loan balances an owner thinks of as debt.
For the denominator, use shareholders' equity from the balance sheet. Equity is not reported on the income statement. A separate statement of shareholders' equity shows how shareholder interests changed over time, so it tells you how the balance moved rather than what to divide by today.
One balance sheet, two numerators
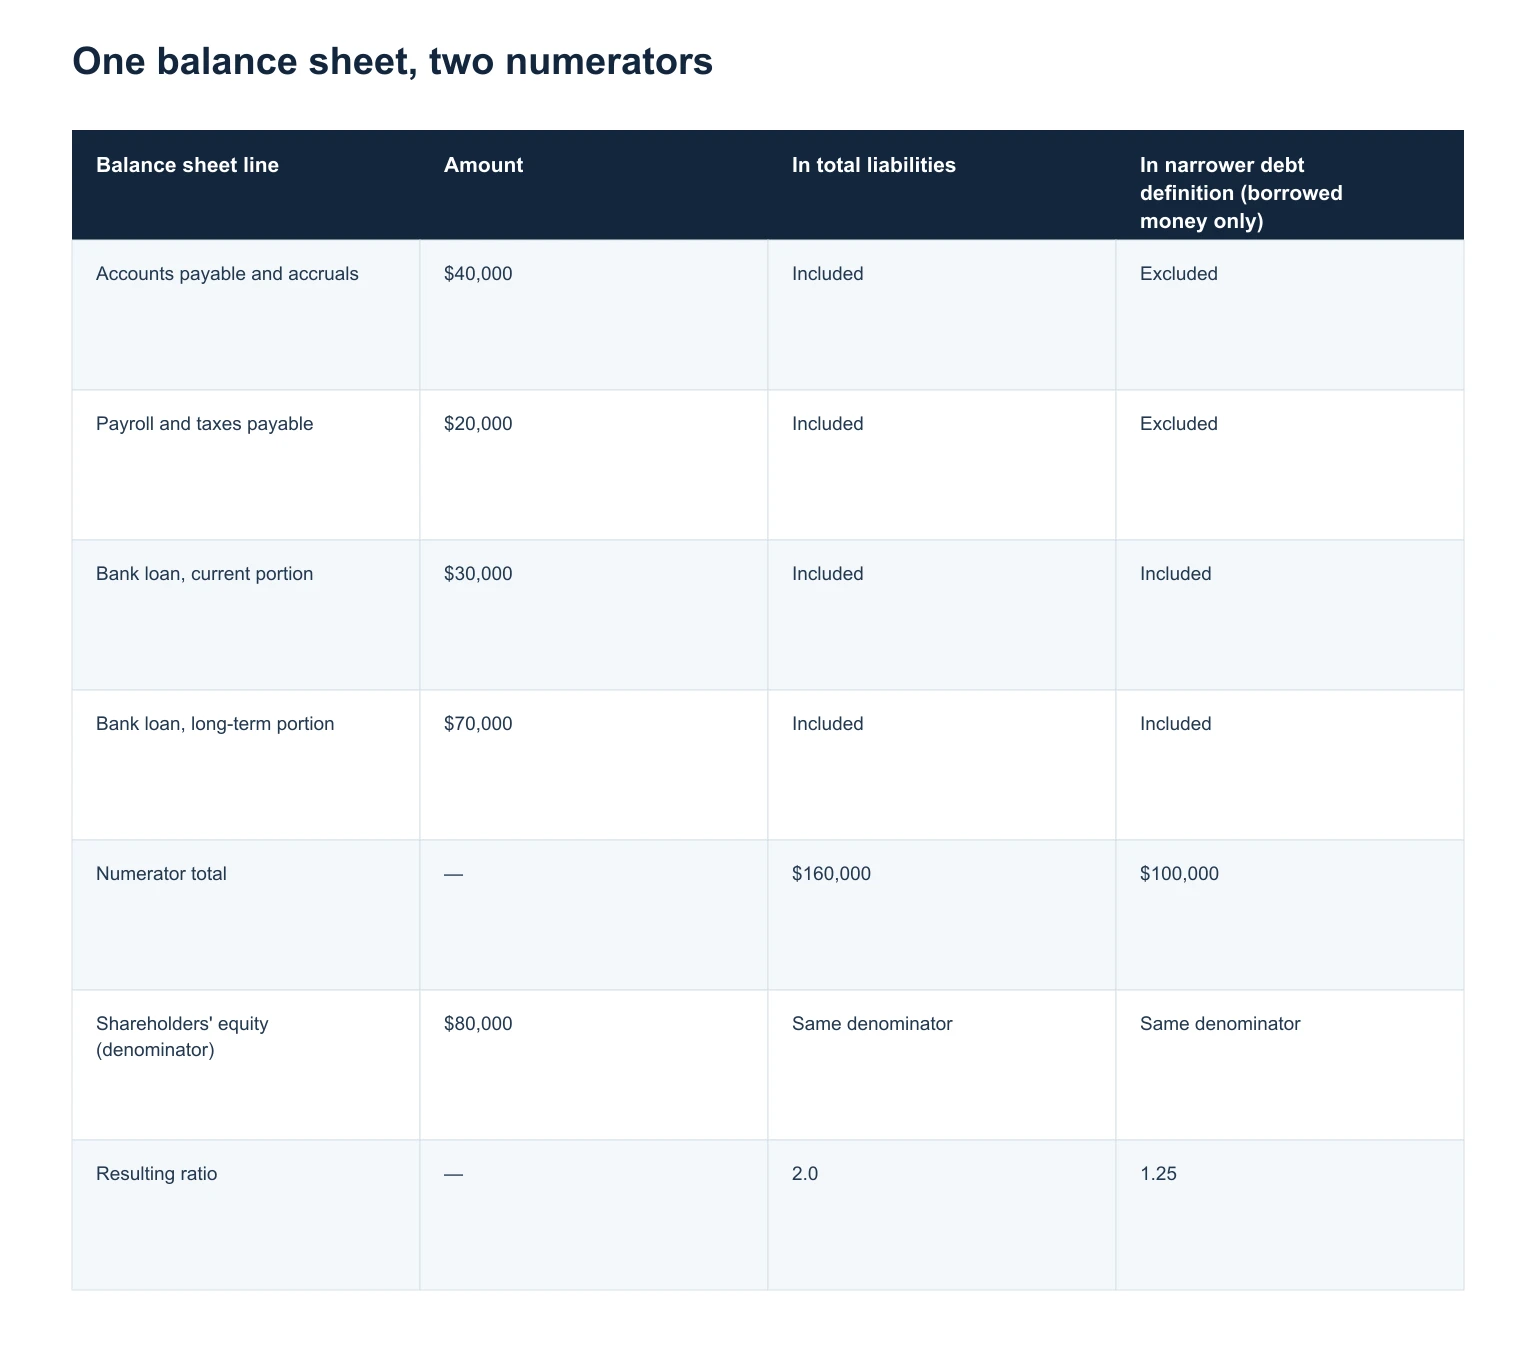
Each row lists one liability line from a sample balance sheet, its amount, and whether it belongs in a total-liabilities numerator or a narrower numerator limited to borrowed money. Against the same $80,000 equity denominator, the total-liabilities definition gives 2.0 and the borrowed-money-only definition gives 1.25.
Balance sheet line: Accounts payable and accruals; Amount: $40,000; In total liabilities: Included; In narrower debt definition (borrowed money only): Excluded
Balance sheet line: Payroll and taxes payable; Amount: $20,000; In total liabilities: Included; In narrower debt definition (borrowed money only): Excluded
Balance sheet line: Bank loan, current portion; Amount: $30,000; In total liabilities: Included; In narrower debt definition (borrowed money only): Included
Balance sheet line: Bank loan, long-term portion; Amount: $70,000; In total liabilities: Included; In narrower debt definition (borrowed money only): Included
Balance sheet line: Numerator total; Amount: —; In total liabilities: $160,000; In narrower debt definition (borrowed money only): $100,000
Balance sheet line: Shareholders' equity (denominator); Amount: $80,000; In total liabilities: Same denominator; In narrower debt definition (borrowed money only): Same denominator
Balance sheet line: Resulting ratio; Amount: —; In total liabilities: 2.0; In narrower debt definition (borrowed money only): 1.25
Worked example
Take a small company with $240,000 in assets and the liability lines shown above. Total liabilities come to $160,000, and $240,000 minus $160,000 leaves $80,000 of shareholders' equity, which should match the equity subtotal printed on the statement.
$160,000 ÷ $80,000 = 2.0
Read that as two dollars of liabilities standing behind every dollar of equity. Swap the numerator for borrowed money alone, the two bank loans totalling $100,000, and the same statement produces 1.25. Neither number is wrong. They answer different questions, which is why the definition has to travel with the figure whenever you quote it.
How to read your result
The ratio describes how the balance sheet is financed at one moment. FINRA frames it as a way for investors to evaluate a company's leverage and how much it uses debt to fund operations, which is a comparison question rather than a verdict.
Three things to ask about any result:
Which numerator produced it, and does the other party use the same one?
How does it compare with this company's own ratio at the previous period end?
How does it compare with businesses that finance similar assets?
One attributed reference point exists in the sources behind this page. BDC says that although the figure varies from industry to industry, a debt-to-equity ratio of around 2 or 2.5 is generally considered good, and reads that as roughly 66 cents of every dollar coming from debt against 33 cents from equity. That is BDC's benchmark with BDC's own caveat attached. It does not transfer automatically to every industry, country or company size.
Why industry and period comparison matter
FINRA's guidance on reading a balance sheet is to compare it with industry peers when assessing financial health. That comparison is what replaces a universal threshold.
Two constraints follow. Compare like with like: FINRA's guidance is to compare a company's balance sheet with industry peers when assessing financial health. And compare statements dated the same way, since a year-end figure and a mid-year figure can differ purely because of where seasonal payables and loan payments happened to land.
Total liabilities versus narrower debt definitions
Authoritative sources word the numerator differently. The SEC and FINRA both describe dividing total liabilities by shareholders' equity. BDC describes the ratio as total debt measured against the amount owners originally invested plus earnings retained over time. Neither wording is the official one, and neither is wrong.
The difference surfaces when your figure meets someone else's. The same statement yields different numbers depending on whether the numerator is total liabilities, as the SEC and FINRA word it, or total debt, as BDC words it. Ask which lines went into the numerator before arguing about the result. This page uses total liabilities throughout, so payables, accruals, taxes and payroll sit in the numerator alongside borrowings.

A broad liability definition and a narrow one draw on different amounts of the same paperwork.
When shareholders' equity is zero or negative
Zero equity leaves nothing to divide by, so the calculation has no answer and the tool above returns an explanation instead of a figure.
Negative equity is the harder case. Recorded liabilities exceed recorded assets, and dividing by a negative denominator prints a negative ratio that can read as reassuringly small next to a positive one. Showing that number would mislead, so the calculator declines to produce it.
What to review instead is the equity section itself, including accumulated deficits and owner contributions, alongside the ability to service what is owed. BDC makes the related point about lenders: a ratio that looks at cash flow as well as the balance sheet lets a bank assess a company's ability to repay its debt more closely.
What the ratio does not show
BDC calls the debt-to-equity ratio a balance sheet-only ratio that does not look at the funds generated by the company. Its illustration is blunt: a company earning $1 million after tax and a company now losing $1 million a year can carry the same debt ratio, while the profitable one is in a much better position to repay.
So the ratio tells you how one date's balance sheet is financed. It says nothing about cash flow, margins, or when loans fall due. Pair it with the income statement and the cash flow statement, which the SEC describes as covering money made and spent, and money moving between a company and the outside world, over a period rather than at a single point in time.
The SEC, FINRA and BDC pages behind this article were last checked on 4 September 2026.
Keeping the balance sheet accurate enough to trust the ratio
Both inputs inherit whatever state the bookkeeping is in. Unreconciled accounts, unrecorded supplier bills and misposted owner contributions move liabilities, equity, or both, and the ratio moves with them. Before calculating, reconcile through the balance sheet date, clear uncategorized transactions, and confirm that loan balances and payables reflect what was owed on that date. Liabilities on the balance sheet cover payroll, taxes and supplier balances as well as borrowings, so a single missing bill changes the numerator.
Booke's AI bookkeeping software page states that QuickBooks Online stays the accounting system of record, that AI Bookkeeper works with the bank feeds already connected there, and that people keep final review and close responsibility. The bookkeeping automation software page describes AI Bookkeeper categorizing eligible transactions and matching documents inside those feeds, which is bank-feed upkeep in QuickBooks Online rather than analysis.
None of that computes or interprets a ratio. AI bookkeeping does not remove every accounting decision or shift professional responsibility onto software, so the figures still come off your balance sheet and the reading is still yours.
Questions readers ask
What is the debt to equity ratio formula?
Total liabilities divided by shareholders' equity, with both figures read from the same balance sheet. The SEC's guide states the calculation that way, and FINRA adds that total shareholder equity equals total assets minus total liabilities.
Where do I find total liabilities and shareholders' equity?
On the balance sheet, which reports what a company owns and owes at a fixed point in time and details assets, liabilities and shareholders' equity. Equity does not appear on the income statement; a separate statement of shareholders' equity shows how shareholder interests changed over a period.
Does this d/e calculator use total debt or total liabilities?
Total liabilities. That covers borrowed money along with rent, taxes, payroll and amounts owed to suppliers, so the output sits above a ratio built from borrowed money alone. Published sources word the numerator differently, which is why the definition is stated here rather than assumed.
What does the debt to equity calculator do when equity is negative?
It returns an explanation rather than a figure. Review the equity section of the balance sheet and repayment capacity instead, the view BDC says helps a bank assess ability to repay.
Is there a good debt to equity ratio?
No universal figure applies. BDC says that although it varies from industry to industry, a ratio of around 2 or 2.5 is generally considered good, and that caveat travels with the number. FINRA's guidance is to compare a company's balance sheet with industry peers when assessing financial health.
What does the ratio miss?
Cash generation. BDC describes it as a balance sheet-only ratio that does not look at the funds a company generates, noting that a business earning $1 million after tax and one losing $1 million a year can show the same debt ratio while their ability to repay differs sharply.
Explore Booke AI workflows
Sources